Forcepoint Next-Gen Firewall and Splunk
Table of contents
License
These contents are licensed under Apache License, Version 2.0. http://www.apache.org/licenses/LICENSE-2.0
TO THE MAXIMUM EXTENT PERMITTED BY APPLICABLE LAW, THE SITE AND ITS CONTENT IS PROVIDED TO YOU ON AN “AS IS,” “AS AVAILABLE” AND “WHERE-IS” BASIS. ALL CONDITIONS, REPRESENTATIONS AND WARRANTIES WITH RESPECT TO THE SITE OR ITS CONTENT, WHETHER EXPRESS, IMPLIED, STATUTORY OR OTHERWISE, INCLUDING ANY IMPLIED WARRANTY OF MERCHANTABILITY, FITNESS FOR A PARTICULAR PURPOSE, OR NON-INFRINGEMENT OF THIRD PARTY RIGHTS, ARE HEREBY DISCLAIMED
Document Revision
| Version | Date | Author | Notes |
|---|---|---|---|
| 0.1 | 18 November 2020 | Rabih Abou Fakher | First draft |
| 0.2 | 25 November 2020 | Neelima Rai | Added Troubleshooting chapter |
| 0.3 | 26 November 2020 | Mattia Maggioli | Review |
| 0.4 | 06 January 2021 | Jonathan Knepher | Review |
| 0.5 | 21 May 2021 | Rabih Abou Fakher | Update commands and URL’s |
Summary
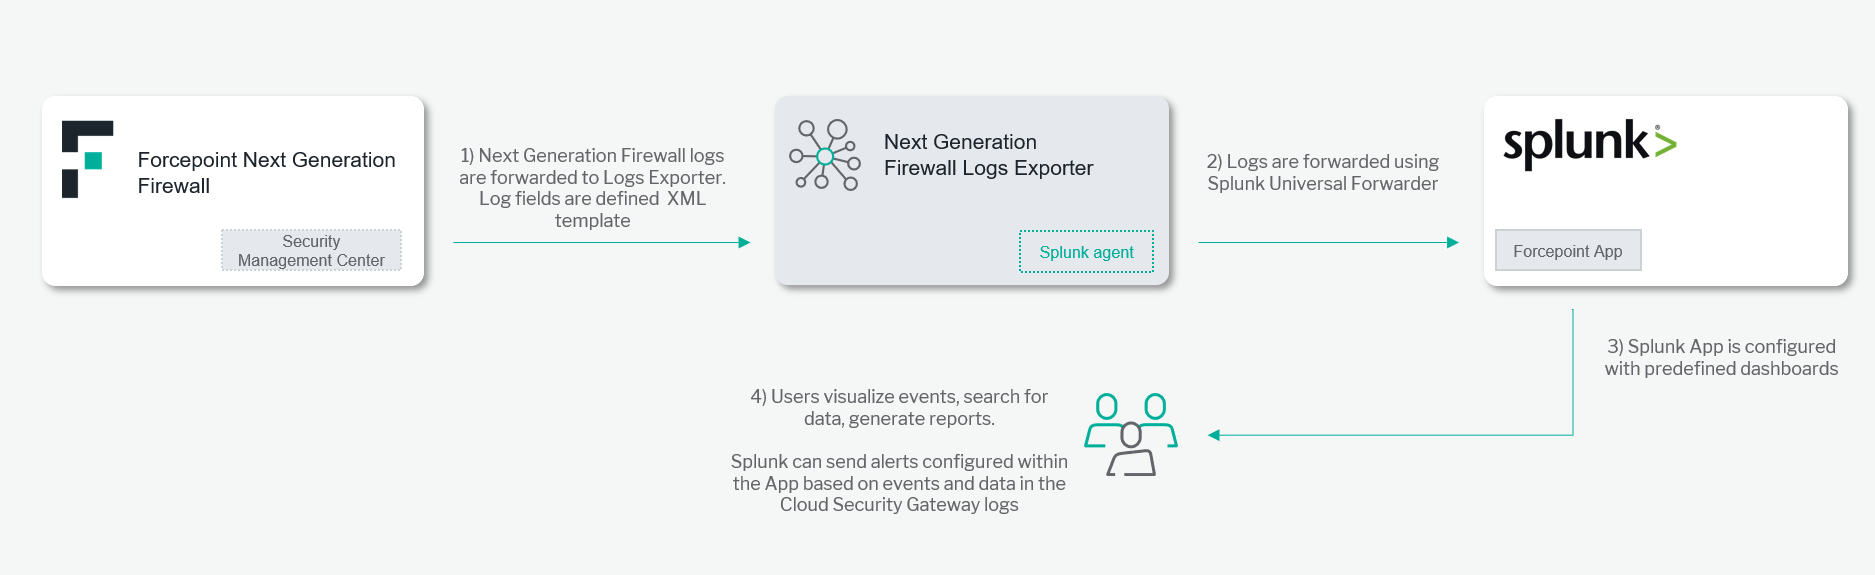
This guide provides step by step instructions to configure an integration between Forcepoint Next Generation Firewall and Splunk so that insights and data contained into Next Generation Firewall logs are automatically exported, indexed and visualized in Splunk.
A description of the workflow between the components involved in this POC is depicted in this diagram:
Demo
Source Code
fp-bd-splunk-universal-forwarder
Caveats
These implementation instructions are tested with the following product versions:
-
Forcepoint SMC 6.7.3
-
Splunk Enterprise 8.0.4.1
The following activities are out of the scope of this document and therefore left to the system administrator, as part of ordinary maintenance procedures to be put in place within the existing infrastructure:
- Monitoring of the scripts, services and applications involved in the solution
Implementation
- Docker: leverages a docker image where the integration component is already installed with all necessary dependencies: the user must only edit the configuration files and run the container on an existing docker setup
The docker images have been tested working with the following requirements
-
Docker 19.03.5
-
The docker host machine should meet the minimum hardware requirements of at least 20 GB of free storage, 2 GB of RAM and a 64-bit system
-
User needs sudo permissions in the docker host machine
The files needed to set up the integration are available at the following link:
- fp-splunk-app-v1.tar.gz and fp-smc-log-fields-v1.xml are available at https://github.com/Forcepoint/fp-bd-splunk-app/releases/latest
Setup Forcepoint App inside Splunk
In order to install the Forcepoint app in Splunk
-
Login to the machine hosting Splunk Enterprise with a user who has administrative privileges.
-
Download the fp-splunk-app package and extract its contents into the /opt/ directory by executing the command below:
PUBLIC_REPO_NAME=fp-bd-splunk-app; \ DEPLOYMENT_NAME=fp-splunk-app-v.*.tar.gz; \ LATEST_VERSION=$(curl -sL "https://github.com/Forcepoint/$PUBLIC_REPO_NAME/releases/latest" | grep "$DEPLOYMENT_NAME" | head -1 | grep -E -o "/v.{0,5}" | cut -c 3-); \ CODE_VERSION=$(curl -sL "https://github.com/Forcepoint/$PUBLIC_REPO_NAME/releases/latest" | grep -E -o "$DEPLOYMENT_NAME" | head -1 | rev | cut -c 8- | awk -F\v- '{print $1}'); \ DEPLOYMENT_NAME_WITH_VERSION=$(echo "${DEPLOYMENT_NAME::-9}$CODE_VERSION.tar.gz"); \ wget --content-disposition "https://github.com/Forcepoint/$PUBLIC_REPO_NAME/releases/download/v$LATEST_VERSION/$DEPLOYMENT_NAME_WITH_VERSION" && \ sudo tar -zxvf $DEPLOYMENT_NAME_WITH_VERSION -C /opt/ && rm -f ./$DEPLOYMENT_NAME_WITH_VERSION* -
Copy forcepoint-solutions directory in the Splunk instance apps directory, then restart Splunk service by executing the command below:
sudo cp -r /opt/fp-splunk-app/forcepoint-solutions $SPLUNK_HOME/etc/apps/; \
sudo $SPLUNK_HOME/bin/splunk restart
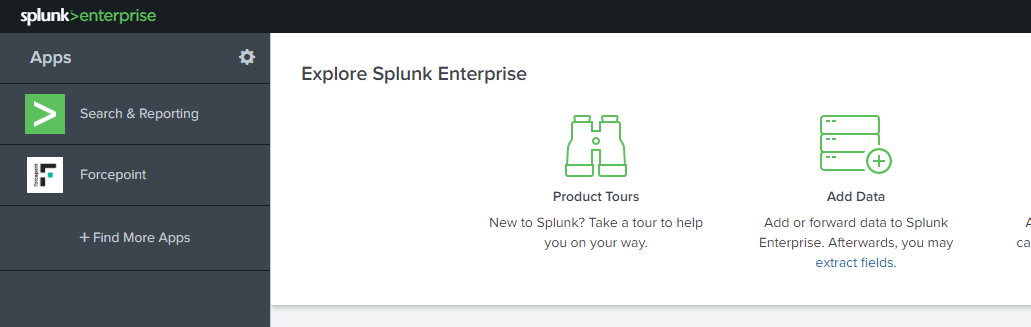
Once Splunk has restarted you’ll be able to see Forcepoint under the Apps tab.
Setup receiving port on the Splunk instance.
Forcepoint logs are ingested into Splunk using a port on the local Splunk machine necessary to receive traffic generated by the Universal Forwarder component. In order to configure the receiving port
-
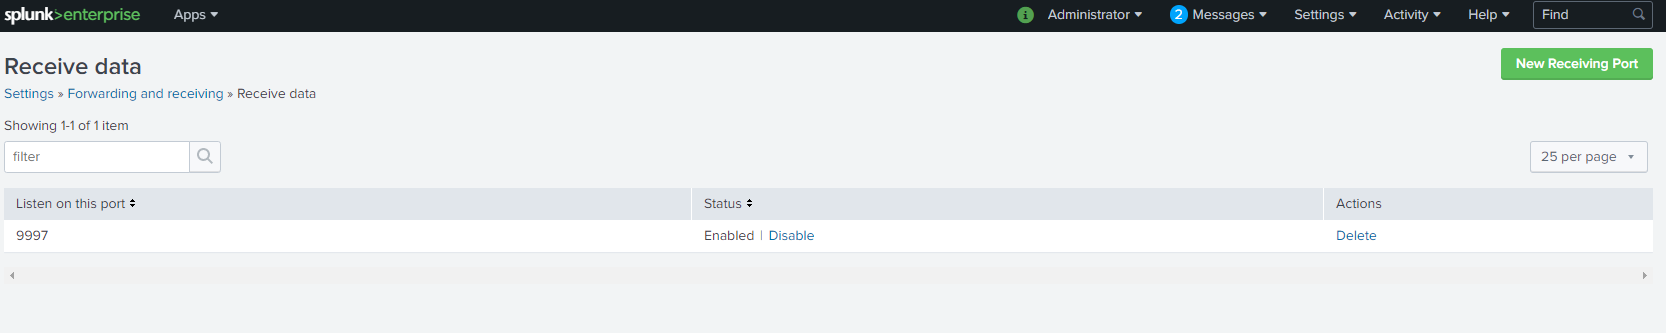
Click on Settings > Forwarding and receiving > Configure receiving
-
Click New Receiving Port > Type the port number (e.g. 9997) > Save
Note: the receiving port must be accessible from the network location of the Universal Forwarder component. Make sure any firewall or network device is configured appropriately to allow the necessary traffic.
Extra steps for distributed Splunk components
If Splunk is deployed in a distributed environment where the search head and the indexer components are deployed in different machines, please follow these additional instructions and repeat the following steps for each indexer machine deployed on the cluster:
-
If it does not exist already, create the props.conf file in the folder $SPLUNK_HOME/etc/system/local/
-
Edit props.conf and append the following configurations:
[cloud-access-security-broker] category=Custom description=Forcepoint Cloud Access Security Broker Logs SHOULD_LINEMERGE=false LINE_BREAKER=([\r\n]+) NO_BINARY_CHECK=true CHARSET=UTF-8 disabled=false KV_MODE = none EXTRACT-cef-message = CEF:\d\|(?<vendor>[^\|]+)\|(?<product>[^\|]+)\|(?<version>[^\|]+)\|(?<signature_id>[^\|]+)\|(?<signature>[^\|]+)\|(?<vendor_severity>[^\|]+)\|(?<cef_message>.*) REPORT-parse_cef = cef_auto_kv_fp,cef_auto_kv_fp_last TIME_FORMAT=%s%3N TIME_PREFIX=start\= [next-generation-firewall] SEDCMD-remove = s/(<6>)//g NO_BINARY_CHECK = 1 pulldown_type = 1 REPORT-xmlkv = xmlkv-alternative TIME_PREFIX=<TIMESTAMP> category=Custom description=Forcepoint Next Generation Firewall Logs [cloud-security-gateway] SHOULD_LINEMERGE=false LINE_BREAKER=([\r\n]+) NO_BINARY_CHECK=true CHARSET=UTF-8 INDEXED_EXTRACTIONS=CSV KV_MODE=none category=Custom description=Forcepoint Cloud Security Gateway Logs disabled=false pulldown_type=true [private-access] TRANSFORMS-null=setnull LINE_BREAKER=([\r\n]+) SHOULD_LINEMERGE=false NO_BINARY_CHECK=true category=Custom description=Forcepoint Private Access Logs disabled=false pulldown_type=true TIME_FORMAT=%Y-%m-%dT%H:%M:%S.%3N%Z TIME_PREFIX="timestamp": " -
If it does not exist already, create the indexes.conf file in the folder $SPLUNK_HOME/etc/system/local/
-
Edit indexes.conf and append the following configurations:
[forcepoint] coldPath = $SPLUNK_DB/forcepoint/colddb enableDataIntegrityControl = 0 enableTsidxReduction = 0 homePath = $SPLUNK_DB/forcepoint/db maxTotalDataSizeMB = 512000 thawedPath = $SPLUNK_DB/forcepoint/thaweddb -
If it does not exist already, create the transforms.conf file in the folder $SPLUNK_HOME/etc/system/local/
-
Edit transforms.conf and append the following configurations:
[setnull] REGEX = Node-internal DEST_KEY = queue FORMAT = nullQueue [xmlkv-alternative] REGEX = <([^\s\>]*)[^\>]*\>([^<]*)\<\/\1\> FORMAT = $1::$2 [cef_auto_kv_fp] SOURCE_KEY = cef_message REGEX = (AD.\w+|\w+)=([^=]+)(?=\s+\w+=*) FORMAT = $1::$2 [cef_auto_kv_fp_last] SOURCE_KEY = cef_message REGEX = (AD.\w+|\w+)=([^=]+)$ FORMAT = $1::$2 -
Log in with the user account running Splunk processes and run the below command:
$SPLUNK_HOME/bin/splunk restart
Implementation – Docker
Setup Splunk Universal Forwarder for Forcepoint Products
The Splunk Universal Forwarder is used to forward Forcepoint Products logs to the Splunk indexer.
Note: The Splunk Universal Forwarder for Forcepoint Products must be able to access the receiving host on the port defined in the Setup receiving port on the Splunk instance chapter.
Note: choose an accessible TCP port for the SMC to forward the log data to it, this must be accessible from the network location of the SMC component. Make sure any firewall or network device is configured appropriately to allow the necessary traffic.
-
Login into docker repository, you’ll be asked to enter your username and password (provided below):
docker login docker.frcpnt.com$ Username: fp-integrations $ Password: t1knmAkn19s -
Run the container with the command below, replacing:
- <universal-forwarder-password-of-your-choice> with a password of your choice (minimum of 8 characters)
- <splunk-indexer-ip-address> with the Splunk indexer receiving IP address
- <splunk-indexer-receiving-port> with the splunk indexer receiving port number
- <smc-forwarding-port> with the SMC chosen forwarding port
 docker run --detach \
     --env "SPLUNK_START_ARGS=--accept-license" \
     --env "SPLUNK_PASSWORD=<universal-forwarder-password-of-your-choice>" \
     --env "SPLUNK_INDEXER_IP_ADDRESS=<splunk-indexer-ip-address>" \
     --env "SPLUNK_INDEXER_RECEIVING_PORT=<splunk-indexer-receiving-port>" \
     --env "FP_ENABLE_NGFW_FORWARD=true" \
     --env "FP_SOURCETYPE_NGFW_MONITOR_VALUE=<smc-forwarding-port>" \
     --name fp-ngfw-splunk-universal-forwarder \
     --publish <smc-forwarding-port>:<smc-forwarding-port> \
     --restart unless-stopped \
     docker.frcpnt.com/fp-splunk-universal-forwarder
Setup Forcepoint SMC Log Forwarding
In order to enable Forcepoint Next Generation Firewall Log forwarding
-
Login to the machine hosting Forcepoint SMC with a user who has administrative privileges.
- Download the fp-smc-log-fields xml file, replace:
- <smc_install_dir> in the first line of the command with the path of the SMC install directory, then excuting the command below:
SMC_INSTALL_DIR="<smc_install_dir>"; \ PUBLIC_REPO_NAME=fp-bd-splunk-app; \ DEPLOYMENT_NAME=fp-smc-log-fields-v.*.xml; \ LATEST_VERSION=$(curl -sL "https://github.com/Forcepoint/$PUBLIC_REPO_NAME/releases/latest" | grep "$DEPLOYMENT_NAME" | head -1 | grep -E -o "/v.{0,5}" | cut -c 3-); \ CODE_VERSION=$(curl -sL "https://github.com/Forcepoint/$PUBLIC_REPO_NAME/releases/latest" | grep -E -o "$DEPLOYMENT_NAME" | head -1 | rev | cut -c 5- | awk -F\v- '{print $1}'); \ DEPLOYMENT_NAME_WITH_VERSION=$(echo "${DEPLOYMENT_NAME::-6}$CODE_VERSION.xml"); \ rm -f $SMC_INSTALL_DIR/data/fields/syslog_templates/$DEPLOYMENT_NAME_WITH_VERSION* 2> /dev/null; \ wget --content-disposition "https://github.com/Forcepoint/$PUBLIC_REPO_NAME/releases/download/v$LATEST_VERSION/$DEPLOYMENT_NAME_WITH_VERSION" \ --directory-prefix=$SMC_INSTALL_DIR/data/fields/syslog_templates/ -
Open your server’s configuration file located in the path below, replace <smc_install_dir> with the path of the SMC install directory
<smc_install_dir>/data/LogServerConfiguration.txt -
Edit or add the SYSLOG_CONF_FILE parameter to point to the absolute path of the xml file fp-smc-log-fields, replace <smc_install_dir> with the path of the SMC install directory
SYSLOG_CONF_FILE=<smc_install_dir>/data/fields/syslog_templates/fp-smc-log-fields-v1.xml -
Restart your Log/Management Server for your changes to take effect, replace <smc_install_dir> with the path of the SMC install directory
<smc_install_dir>/bin/sgRestartLogSrv.sh -
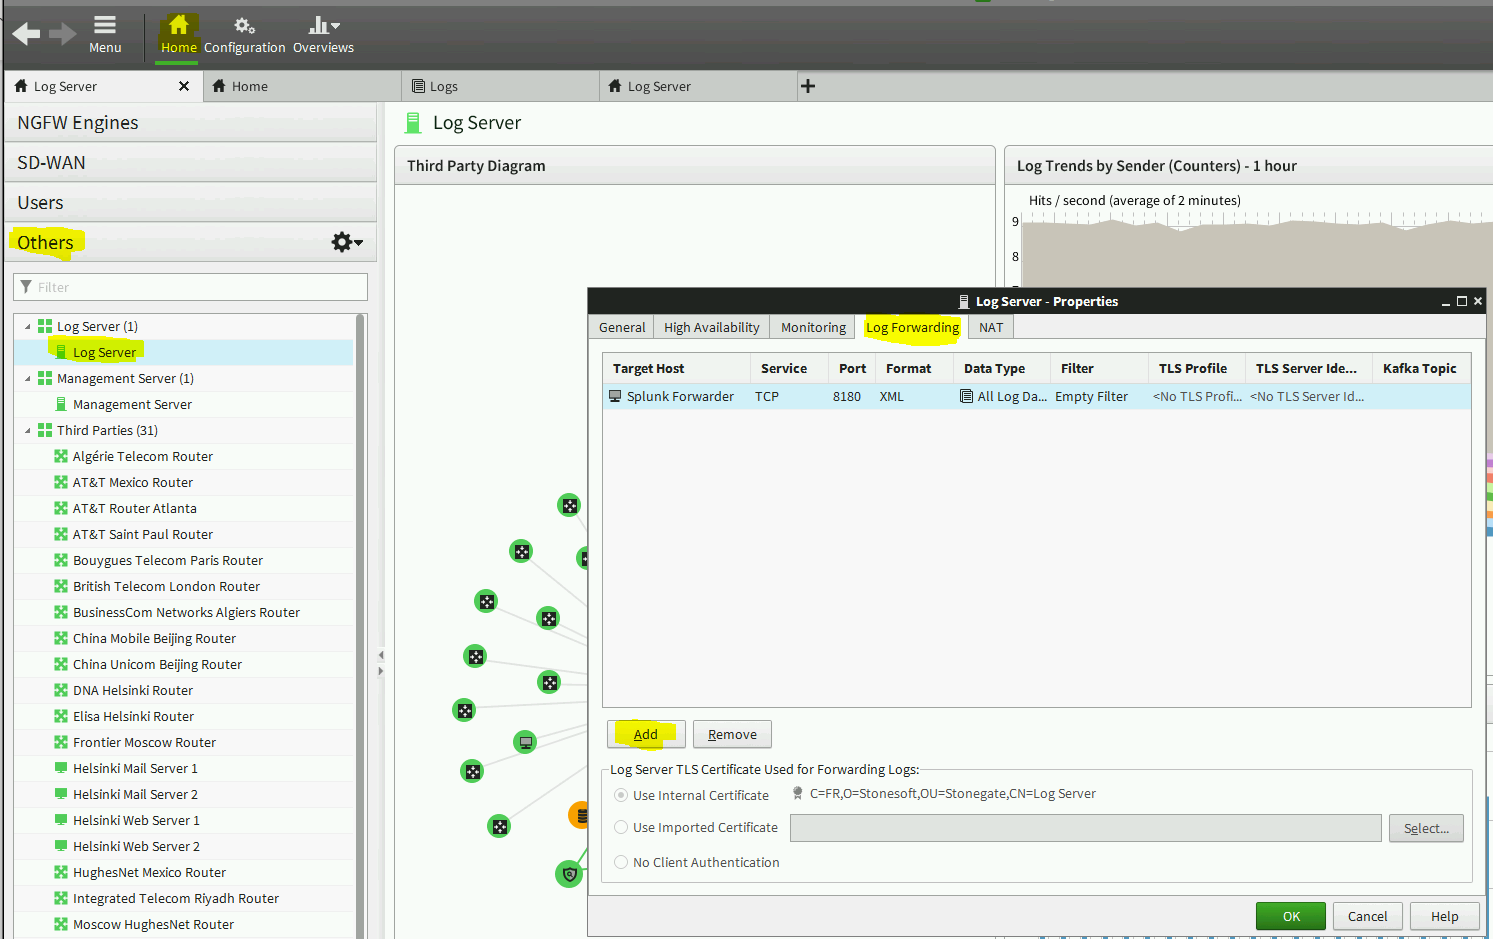
Open the SMC UI, click on the Home button then click Others
-
Double click on the Log Server, then select Log Forwarding tab
-
Click Add button and add the following:
-
Service: TCP
-
Port: enter the SMC forwarding port number
-
Format: select XML
-
Data Type: select All Log Data
-
Target Host: select the Splunk Forcepoint Next Generation Firewall Universal Forwarder IP address
In order to add a new host (Splunk Forcepoint Next Generation Firewall Universal Forwarder IP address), follow the steps below:
-
-
Under the Target Host, double click <Select>
-
Click the Settings icon > New > Host
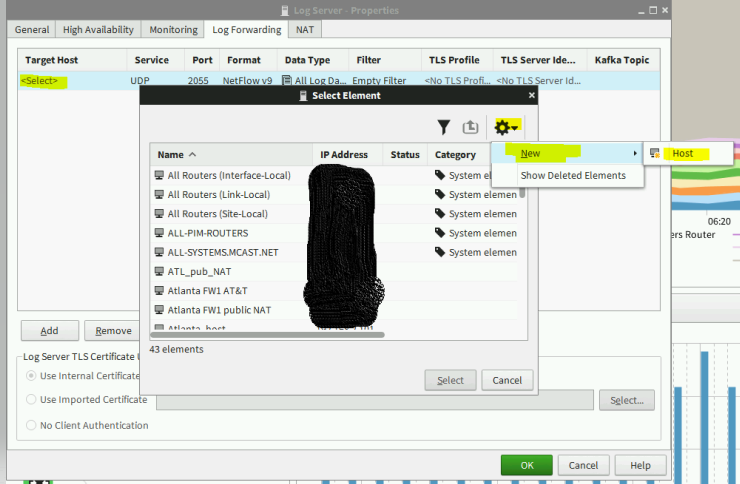
-
Type the name of the host and the Universal Forwarder IP address
-
Click OK
-
Select the new host and click Select
-
Click OK.
Once the above steps are done, the forwarding is a real time log data streaming: the data will be visible as soon as received and loaded in Splunk.
Troubleshooting
Follow these steps to identify issues impacting the normal operation of the integration described in this document.
Docker Implementation
Validate the prerequisites
Make sure the prerequisites described in the Summary chapter are all satisfied:
-
Check the version of Splunk and Forcepoint SMC in use are listed as compatible
Splunk Enterprise 8.0.4.1 Forcepoint SMC 6.7.3 -
User must use a CASB account with admin role for this integration
-
The host machine should have Docker 19.03.5 installed
-
The docker host machine should meet the minimum hardware requirements of 2GB RAM, 20GB free storage and the system needs to be 64-bit
-
User needs sudo permissions in the docker host machine
-
Check the user can download the required files with the link below:
https://github.com/Forcepoint/fp-bd-splunk-app/releases/latest
Check network connectivity
Make sure firewalls or other security appliances are not impacting the network connectivity necessary for the operation of all components involved in this integration:
-
Check the host machine has connectivity to the internet: execute the following command on the Docker host machine:
ping -c 2 www.splunk.com
Once done check the result is similar to below:
PING www.splunk.com (10.10.120.12) 56(84) bytes of data.
64 bytes from 10.10.120.12 (10.10.120.12): icmp\_seq=1 ttl=128 time=179 ms
64 bytes from 10.10.120.12 (10.10.120.12): icmp\_seq=1 ttl=128 time=181 ms
Check dependencies are installed
Make sure the software dependencies needed by the components involved in this integration are installed:
-
Check the host machine has docker installed: Execute the following command on the host machine:
docker info
Check the first few lines of the output are similar to below:
Client:
Debug Mode: false

Server:
Containers: 3
Running: 2
Paused: 0
Stopped: 1
Images: 3
**Server Version: 19.03.5**
Check all components are configured and running properly
Make sure the products and services involved in this integration are configured as expected and they are running:
-
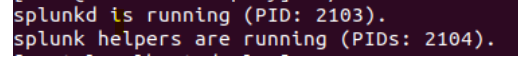
Check the splunk fp-ngfw-splunk-universal-forwarder service is running.
docker exec -it -u splunk fp-ngfw-splunk-universal-forwarder /bin/bash -c "/opt/splunkforwarder/bin/splunk status"Check the output is similar to the picture below:
-
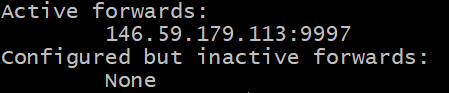
Check if the connection between the forwarder and the Splunk instance is active: Execute the following command on the host machine:
docker exec -it fp-ngfw-splunk-universal-forwarder /bin/bash -c "/opt/splunkforwarder/bin/splunk list forward-server"It might prompt you for username (admin) and password (the one you setup in step 3 of Implementation - Docker). Verify the output is similar to below:
-
Check the splunk fp-ngfw-splunk-universal-forwarder is forwarding data with no errors.
docker exec -it fp-ngfw-splunk-universal-forwarder /bin/bash -c "cat /opt/splunkforwarder/var/log/splunk/health.log"
Check the output of tail health.log does not contain error messages.
- Check after running the integration: user should see data in the Splunk app
Check the output is similar to the one shown below: