Forcepoint Cloud Security Gateway and Splunk
Table of contents
License
These contents are licensed under Apache License, Version 2.0. http://www.apache.org/licenses/LICENSE-2.0
TO THE MAXIMUM EXTENT PERMITTED BY APPLICABLE LAW, THE SITE AND ITS CONTENT IS PROVIDED TO YOU ON AN “AS IS,” “AS AVAILABLE” AND “WHERE-IS” BASIS. ALL CONDITIONS, REPRESENTATIONS AND WARRANTIES WITH RESPECT TO THE SITE OR ITS CONTENT, WHETHER EXPRESS, IMPLIED, STATUTORY OR OTHERWISE, INCLUDING ANY IMPLIED WARRANTY OF MERCHANTABILITY, FITNESS FOR A PARTICULAR PURPOSE, OR NON-INFRINGEMENT OF THIRD PARTY RIGHTS, ARE HEREBY DISCLAIMED
Document Revision
| Version | Date | Author | Notes |
|---|---|---|---|
| 0.1 | 14 September 2020 | Rabih Abou Fakher | First draft |
| 0.2 | 17 September 2020 | Neelima Rai | Added Troubleshooting chapter |
| 0.3 | 18 September 2020 | Mattia Maggioli | Review |
| 0.4 | 21 May 2021 | Rabih Abou Fakher | Update commands and URL’s |
Summary
This guide provides step by step instructions to configure an integration between Forcepoint Cloud Security Gateway and Splunk so that insights and data contained into Cloud Security Gateway logs for Web and Email security are automatically exported, indexed and visualized in Splunk.
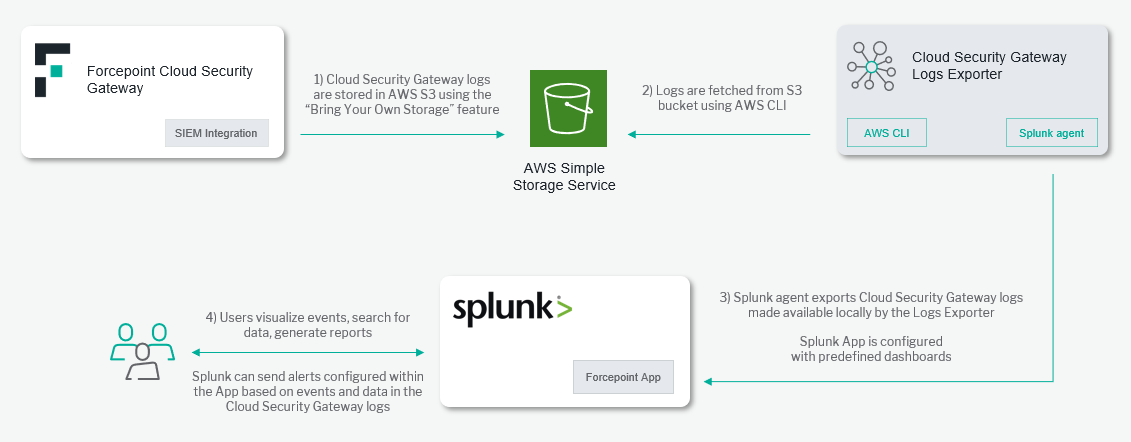
A description of the workflow between the components involved in this POC is depicted in this diagram:
Demo
Source Code
fp-bd-splunk-universal-forwarder
Caveats
These implementation instructions are tested with the following product versions:
-
Forcepoint Cloud Security Gateway – as of September 2020
-
Splunk Enterprise 8.0.4.1
This integration is developed using the Bring Your Own Storage feature of Forcepoint Cloud Security Gateway. It is therefore assumed that Forcepoint Cloud Security Gateway logs are stored within an Amazon S3 bucket. Instructions are provided in this document to switch from the default log storage (Forcepoint storage) to Amazon S3: the user must configure storage to Amazon S3 in order to avail of this integration.
The following activities are out of the scope of this document and therefore left to the system administrator, as part of ordinary maintenance procedures to be put in place within the existing infrastructure:
- Monitoring of the scripts, services and applications involved in the solution
Implementation
Two implementation options are provided in this document
- Docker – leverages a docker image where the integration component is already installed with all necessary dependencies: the user must only edit the configuration files and run the container on an existing docker setup
The docker images have been tested working with the following requirements
-
Docker 19.03.5
-
The docker host machine should meet the minimum hardware requirements of at least 50 GB of free storage, 2 GB of RAM and a 64-bit system
-
User needs sudo permissions in the docker host machine
The files needed to set up the integration are available at the following links:
-
fp-splunk-app-v1.tar.gz are available at https://github.com/Forcepoint/fp-bd-splunk-app/releases/latest
-
setup-aws-credentials.sh available at https://github.com/Forcepoint/fp-bd-log-import-service/releases/latest
Register a user in AWS and retrieve credentials
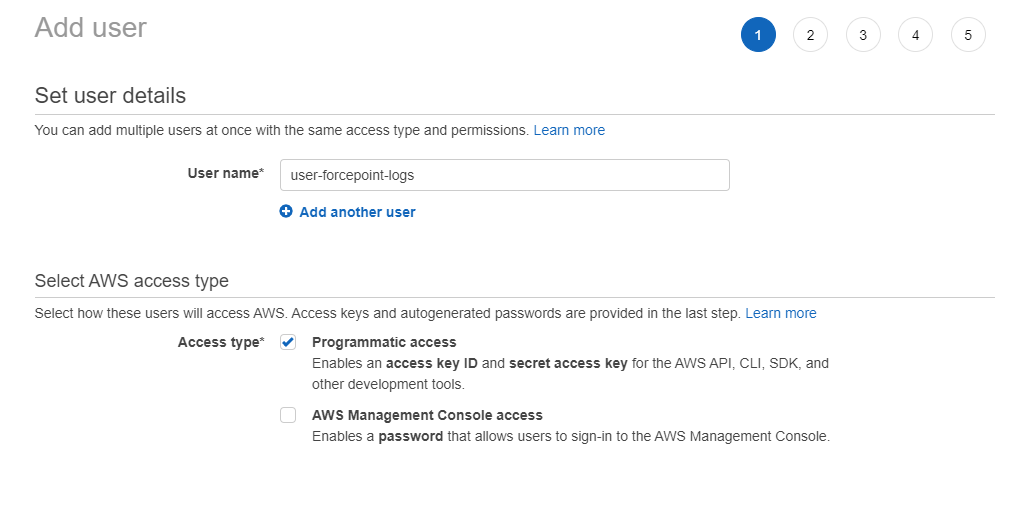
To create a user, set required polices, and retrieve the user’s credentials do the following steps:
-
Sign into the AWS Management Console and open the Amazon IAM console
-
Open the Users section and click Add User in the top left
-
Enter a name for the new user and select Programmatic access in the Access type section
-
Click on Next: Permissions
-
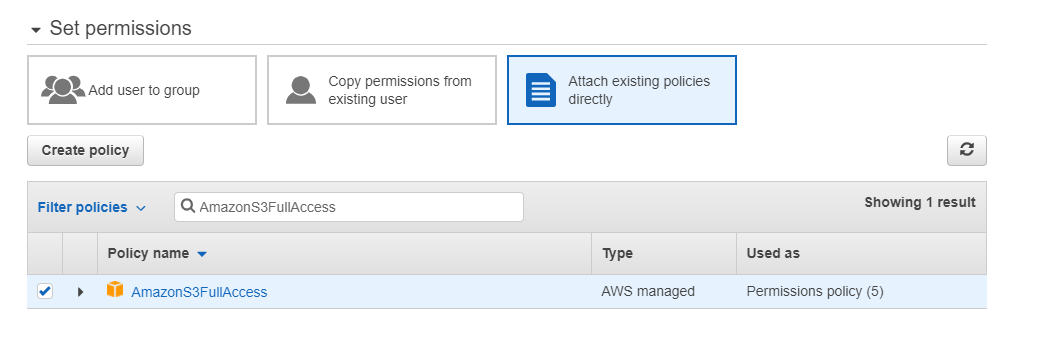
Select Attach existing policies directly and search for AmazonS3FullAccess
-
Select AmazonS3FullAccess and click Next: Tags
-
Add tags if required by your organization policies (tags are not required by this integration)
-
Review the details and then click Create user
-
In the next screen you will be presented with your new user along with your Access key ID and Secret access key: save these or the CSV file in a secure location. This is the only time the Secret access key will be available.
Configure SIEM Integration inside Forcepoint Cloud Security Gateway
Log Export permissions
Ensure your account has Log Export permission.
-
Login to the Forcepoint Cloud Security Gateway portal
-
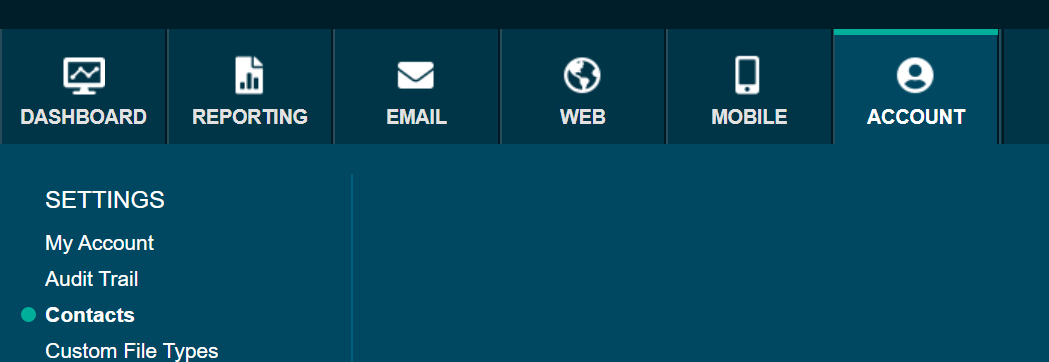
Click ACCOUNT > Contacts
-
Under the User Name column, find your username and click on it.
-
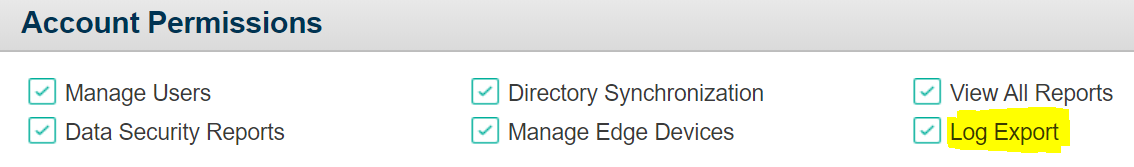
In the Account Permissions section, ensure the Log Export box is clicked.
-
Click Save
Enable SIEM Logging
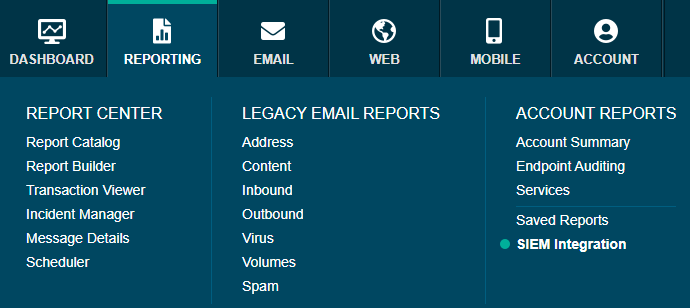
In your Security Portal, navigate to Reporting > Account Reports > SIEM Integration
To export web/email logs do the following steps:
- Select Web Security as a data type:
- Enable data export:
-
From the Attributes section, drag and drop the following attributes into the columns section:
-
Risk Class
-
Action
-
User
-
Policy
-
Category
-
Domain
-
Protocol
-
URL – Full
-
Cloud App
-
Cloud App Category
-
Cloud App Risk Level
-
Connection IP
-
Connection IP City
-
Connection IP Country
-
Connection Name
-
Destination IP
-
Source IP
-
Analytic Name
-
File Sandbox Status
-
Severity
-
Threat Name
-
Threat Type
-
Date & Time
-
File Name
-
File Type
-
Operating System
-
User Agent
-
Authentication Method
-
Classification Type
-
Date Center
-
Filtering Source
-
HTTP Status Code
-
Request Method
-
Bytes Received
-
Bytes Sent
-
Make sure all the above attributes are selected and DO NOT remove any of these attributes from the columns section: data ingest and visualization will not work as expected if data are missing.
-
Click Save
-
Change Data type to Email Security
-
Enable data export
-
From the Attributes section, drag and drop the following attributes into the columns section:
-
Direction
-
From: Address
-
Policy
-
Recipient Address
-
Recipient Domain
-
Sender Domain
-
Sender Name
-
Subject
-
Action
-
Black/Whitelisted
-
Blocked Attachment Ext
-
Filtering Reason
-
Sender IP
-
Sender IP Country
-
Attachment File Type
-
Attachment Filename
-
Emb. URL Risk Class
-
Emb. URL Severity
-
Advanced Encryption
-
File Sandbox status
-
Virus Name
-
Date & Time
-
Message Size
-
Spam score
-
Attachment Size
-
Make sure all the above attributes are selected and DO NOT remove any of these attributes from the columns section: data ingest and visualization will not work as expected if data are missing.
- Click Save
Switch logs storage to Amazon S3
As described in the Summary chapter of this document, Forcepoint Cloud Security Gateway web/email logs are expected to be stored within an Amazon S3 bucket using the Bring Your Own Storage feature of Forcepoint Cloud Security Gateway.
To switch logs storage from the default location into Amazon S3 please follow the instructions in the UI of Forcepoint Cloud Security Gateway or in the SIEM Guide at this link https://www.websense.com/content/support/library/web/hosted/siem_guide/cloud_SIEM_Guide.pdf
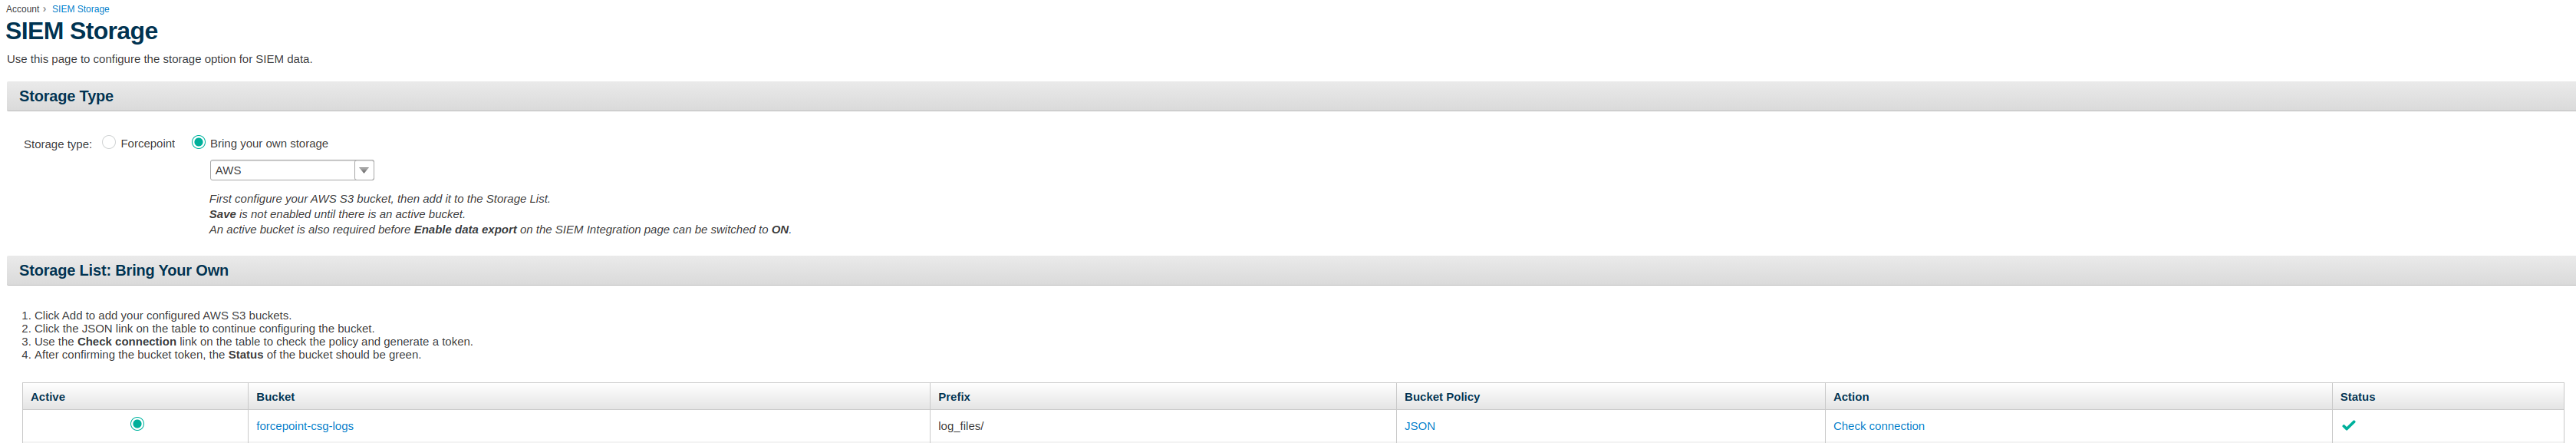
To create a new Amazon S3 bucket follow these steps:
-
Sign into the AWS Management Console and open the Amazon S3 console
-
Choose Create bucket.
-
In Bucket’s name, enter a DNS-compliant name for your bucket. The bucket name must:
-
Be unique across all of Amazon S3.
-
Be between 3 and 63 characters long
-
Not contain uppercase characters.
-
Start with a lowercase letter or number.
-
-
In Region, choose the AWS Region.
-
Click Create
-
Modify <CSG-AWS-Account-ID> and place the json content below into the bucket policy. Note the Resource value has to match the bucket name created in the step above e.g. in the example below the bucket name is forcepoint-csg-logs and the prefix is log_files
  {
    "Version": "2012-10-17",
    "Statement": [
        {
            "Sid": "",
            "Effect": "Allow",
            "Principal": {
                "AWS": "arn:aws:iam::<CSG-AWS-Account-ID>:root"
            },
            "Action": "s3:PutObject",
            "Resource": "arn:aws:s3:::forcepoint-csg-logs/log_files/*"
        }
    ]
  }
Once SIEM Integration is configured with your Amazon S3 bucket, any new web/email log generated by Forcepoint Cloud Security Gateway will be sent to your S3 bucket. Our Log Exporter component will fetch the logs from the S3 bucket.
Setup Forcepoint App inside Splunk
In order to install the Forcepoint app in Splunk
-
Login to the machine hosting Splunk Enterprise with a user who has administrative privileges.
-
Download the fp-splunk-app package and extract its contents into the /opt/ directory by executing the command below
PUBLIC_REPO_NAME=fp-bd-splunk-app; \ DEPLOYMENT_NAME=fp-splunk-app-v.*.tar.gz; \ LATEST_VERSION=$(curl -sL "https://github.com/Forcepoint/$PUBLIC_REPO_NAME/releases/latest" | grep "$DEPLOYMENT_NAME" | head -1 | grep -E -o "/v.{0,5}" | cut -c 3-); \ CODE_VERSION=$(curl -sL "https://github.com/Forcepoint/$PUBLIC_REPO_NAME/releases/latest" | grep -E -o "$DEPLOYMENT_NAME" | head -1 | rev | cut -c 8- | awk -F\v- '{print $1}'); \ DEPLOYMENT_NAME_WITH_VERSION=$(echo "${DEPLOYMENT_NAME::-9}$CODE_VERSION.tar.gz"); \ wget --content-disposition "https://github.com/Forcepoint/$PUBLIC_REPO_NAME/releases/download/v$LATEST_VERSION/$DEPLOYMENT_NAME_WITH_VERSION" && \ sudo tar -zxvf $DEPLOYMENT_NAME_WITH_VERSION -C /opt/ && rm -f ./$DEPLOYMENT_NAME_WITH_VERSION* -
Copy forcepoint-solutions directory in the Splunk instance apps directory, then restart Splunk service by executing the command below:
sudo cp -r /opt/fp-splunk-app/forcepoint-solutions $SPLUNK_HOME/etc/apps/; \
sudo $SPLUNK_HOME/bin/splunk restart
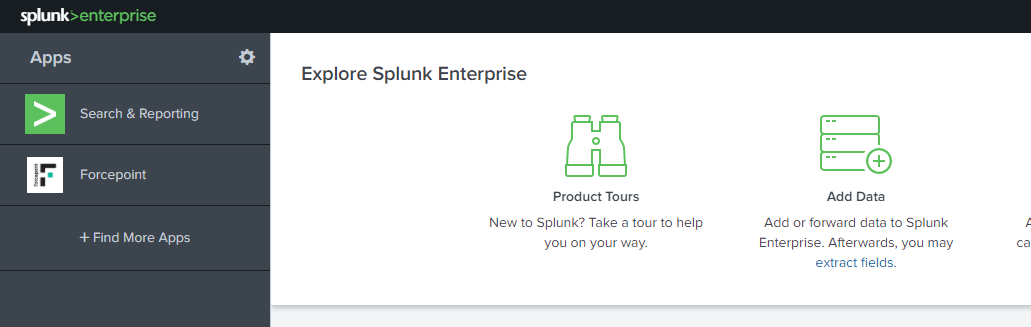
Once Splunk has restarted you’ll be able to see Forcepoint under the Apps tab.
Setup receiving port on the Splunk instance.
Forcepoint logs are ingested into Splunk using a port on the local Splunk machine necessary to receive traffic generated by the Universal Forwarder component. In order to configure the receiving port
-
Click on Settings > Forwarding and receiving > Configure receiving
-
Click New Receiving Port > Type the port number (e.g. 9997) > Save
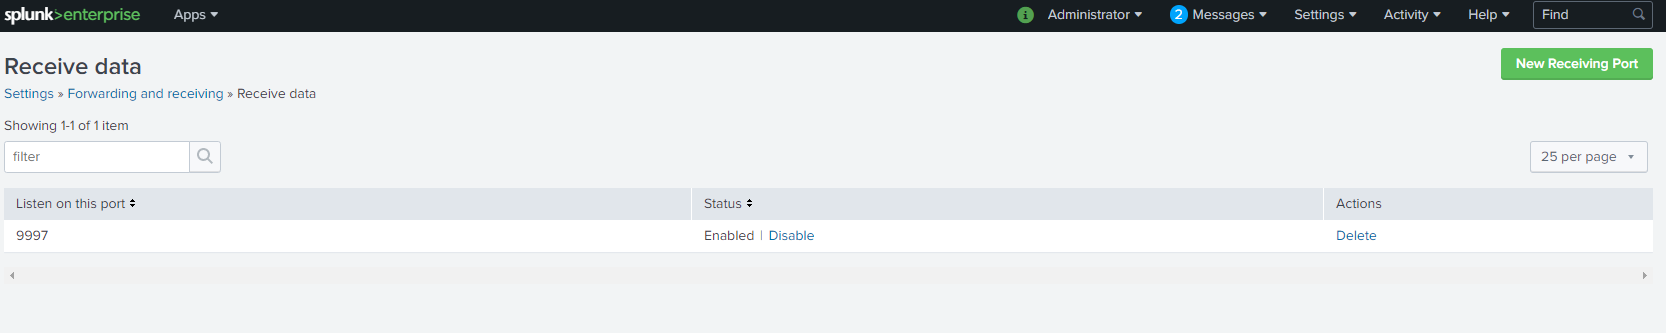
Note: the receiving port must be accessible from the network location of the Universal Forwarder component. Make sure any firewall or network device is configured appropriately to allow the necessary traffic.
Extra steps for distributed Splunk components
If Splunk is deployed in a distributed environment where the search head and the indexer components are deployed in different machines, please follow these additional instructions and repeat the following steps for each indexer machine deployed on the cluster:
-
If it does not exist already, create the props.conf file in the folder $SPLUNK_HOME/etc/system/local/
-
Edit props.conf and append the following configurations:
[cloud-access-security-broker] category=Custom description=Forcepoint Cloud Access Security Broker Logs SHOULD_LINEMERGE=false LINE_BREAKER=([\r\n]+) NO_BINARY_CHECK=true CHARSET=UTF-8 disabled=false KV_MODE = none EXTRACT-cef-message = CEF:\d\|(?<vendor>[^\|]+)\|(?<product>[^\|]+)\|(?<version>[^\|]+)\|(?<signature_id>[^\|]+)\|(?<signature>[^\|]+)\|(?<vendor_severity>[^\|]+)\|(?<cef_message>.*) REPORT-parse_cef = cef_auto_kv_fp,cef_auto_kv_fp_last TIME_FORMAT=%s%3N TIME_PREFIX=start\= [next-generation-firewall] SEDCMD-remove = s/(<6>)//g NO_BINARY_CHECK = 1 pulldown_type = 1 REPORT-xmlkv = xmlkv-alternative TIME_PREFIX=<TIMESTAMP> category=Custom description=Forcepoint Next Generation Firewall Logs [cloud-security-gateway] SHOULD_LINEMERGE=false LINE_BREAKER=([\r\n]+) NO_BINARY_CHECK=true CHARSET=UTF-8 INDEXED_EXTRACTIONS=CSV KV_MODE=none category=Custom description=Forcepoint Cloud Security Gateway Logs disabled=false pulldown_type=true [private-access] TRANSFORMS-null=setnull LINE_BREAKER=([\r\n]+) SHOULD_LINEMERGE=false NO_BINARY_CHECK=true category=Custom description=Forcepoint Private Access Logs disabled=false pulldown_type=true TIME_FORMAT=%Y-%m-%dT%H:%M:%S.%3N%Z TIME_PREFIX="timestamp": " -
If it does not exist already, create the indexes.conf file in the folder $SPLUNK_HOME/etc/system/local/
-
Edit indexes.conf and append the following configurations:
[forcepoint] coldPath = $SPLUNK_DB/forcepoint/colddb enableDataIntegrityControl = 0 enableTsidxReduction = 0 homePath = $SPLUNK_DB/forcepoint/db maxTotalDataSizeMB = 512000 thawedPath = $SPLUNK_DB/forcepoint/thaweddb -
If it does not exist already, create the transforms.conf file in the folder $SPLUNK_HOME/etc/system/local/
-
Edit transforms.conf and append the following configurations:
[setnull] REGEX = Node-internal DEST_KEY = queue FORMAT = nullQueue [xmlkv-alternative] REGEX = <([^\s\>]*)[^\>]*\>([^<]*)\<\/\1\> FORMAT = $1::$2 [cef_auto_kv_fp] SOURCE_KEY = cef_message REGEX = (AD.\w+|\w+)=([^=]+)(?=\s+\w+=*) FORMAT = $1::$2 [cef_auto_kv_fp_last] SOURCE_KEY = cef_message REGEX = (AD.\w+|\w+)=([^=]+)$ FORMAT = $1::$2 -
Log in with the user account running Splunk processes and run the below command:
$SPLUNK_HOME/bin/splunk restart
Implementation – Docker
Setup Splunk Universal Forwarder for Forcepoint Products
The Splunk Universal Forwarder is used to forward Forcepoint Products logs to the Splunk indexer.
Note: The Splunk Universal Forwarder for Forcepoint Products must be able to access the receiving host on the port defined in the Setup receiving port on the Splunk instance chapter.
-
Login into docker repository, you’ll be asked to enter your username and password (provided below):
docker login docker.frcpnt.com$ Username: fp-integrations $ Password: t1knmAkn19s -
Run the container with the command below, replacing:
- <universal-forwarder-password-of-your-choice> with a password of your choice (minimum of 8 characters)
- <splunk-indexer-ip-address> with the Splunk indexer receiving IP address
- <splunk-indexer-receiving-port> with the splunk indexer receiving port number
   docker run --detach \
     --env "SPLUNK_START_ARGS=--accept-license" \
     --env "SPLUNK_PASSWORD=<universal-forwarder-password-of-your-choice>" \
     --env "SPLUNK_INDEXER_IP_ADDRESS=<splunk-indexer-ip-address>" \
     --env "SPLUNK_INDEXER_RECEIVING_PORT=<splunk-indexer-receiving-port>" \
     --env "FP_ENABLE_CSG_FORWARD=true" \
     --name fp-csg-splunk-universal-forwarder \
     --restart always \
     --volume FpLogsVolume:/app/forcepoint-logs:ro \
     docker.frcpnt.com/fp-splunk-universal-forwarder
Setup Forcepoint Cloud Security Gateway Log Importer Service
The Forcepoint Cloud Security Gateway log importer service is used to download the Forcepoint Cloud Security Gateway logs from the S3 bucket.
-
Download setup-aws-credentials script into the /opt/fp-aws-log-import-service directory by executing the command below:
PUBLIC_REPO_NAME=fp-bd-log-import-service; \ DEPLOYMENT_NAME=setup-aws-credentials.sh; \ LATEST_VERSION=$(curl -sL "https://github.com/Forcepoint/$PUBLIC_REPO_NAME/releases/latest" | grep "$DEPLOYMENT_NAME" | head -1 | grep -E -o "/v.{0,5}" | cut -c 3-); \ mkdir -p /opt/fp-aws-log-import-service 2> /dev/null; \ rm -f /opt/fp-aws-log-import-service/$DEPLOYMENT_NAME* 2> /dev/null; \ wget --content-disposition "https://github.com/Forcepoint/$PUBLIC_REPO_NAME/releases/download/v$LATEST_VERSION/$DEPLOYMENT_NAME" \ --directory-prefix=/opt/fp-aws-log-import-service/ -
Provide the AWS credentials necessary to access Forcepoint Cloud Security Gateway logs: the script will ask you to enter the AWS Access Key ID and the AWS Secret Key created as instructed in the Register a user in AWS and retrieve credentials chapter, run the command below:
sudo chmod +x /opt/fp-aws-log-import-service/setup-aws-credentials.sh; \ /opt/fp-aws-log-import-service/setup-aws-credentials.sh -
Login into docker repository, you’ll be asked to enter your username and password (provided below):
docker login docker.frcpnt.com$ Username: fp-integrations $ Password: t1knmAkn19s -
Run the container with the command below, replacing: <AWS-S3-Bucket-Name> with the S3 bucket name
   docker run --detach \
     --env "CSG_S3_URL=s3://<AWS-S3-Bucket-Name>" \
     --env "FP_ENABLE_CSG_SYNC=true" \
     --name fp-csg-aws-log-import-service \
     --restart always \
     --volume /opt/fp-aws-log-import-service/.aws:/root/.aws \
     --volume FpLogsVolume:/forcepoint-logs \
     --volume FpErrorLogsVolume:/app/fp-aws-log-import-service/logs \
     docker.frcpnt.com/fp-aws-log-import-service
Troubleshooting
Follow these steps to identify issues impacting the normal operation of the integration described in this document.
Docker Implementation
Validate the prerequisites
Make sure the prerequisites described in the Summary chapter are all satisfied:
-
Check the version of Splunk in use is listed as compatible
Splunk Enterprise 8.0.4.1 -
The host machine should have Docker 19.03.5 installed
-
The docker host machine should meet the minimum hardware requirements of 2GB RAM, 50GB free storage and the system needs to be 64-bit
-
User needs sudo permissions in the docker host machine
-
Check the user can download the required files with the link below:
  https://github.com/Forcepoint/fp-bd-splunk-app/releases/latest
  https://github.com/Forcepoint/fp-bd-log-import-service/releases/latest
Check network connectivity
Make sure firewalls or other security appliances are not impacting the network connectivity necessary for the operation of all components involved in this integration:
-
Check the host machine has connectivity to the internet: execute the following command on the Docker host machine:
ping -c 2 www.aws.com
Once done check the result is similar to below:
PING www.aws.com (10.10.120.12) 56(84) bytes of data.
64 bytes from 10.10.120.12 (10.10.120.12): icmp_seq=1 ttl=128 time=179 ms
64 bytes from 10.10.120.12 (10.10.120.12): icmp_seq=1 ttl=128 time=181 ms
Check dependencies are installed
Make sure the software dependencies needed by the components involved in this integration are installed:
-
Check the host machine has docker installed: Execute the following command on the host machine:
docker info
Check the first few lines of the output are similar to below:
Client:
Debug Mode: false

Server:
Containers: 3
Running: 2
Paused: 0
Stopped: 1
Images: 3
 **Server Version: 19.03.5**
Check all components are configured and running properly
Make sure the products and services involved in this integration are configured as expected and they are running:
- Check the splunk fp-csg-aws-log-import-service is forwarding data with no errors with the following command:
sudo cat /var/lib/docker/volumes/FpCsgErrorLogsVolume/_data/sync-errors.log
Check the output does not contain error messages.
-
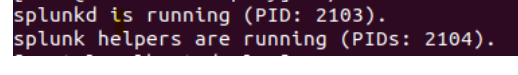
Check the splunk fp-csg-splunk-universal-forwarder service is running.
docker exec -it -u splunk fp-csg-splunk-universal-forwarder /bin/bash -c "/opt/splunkforwarder/bin/splunkstatus"Check the output is similar to the picture below
-
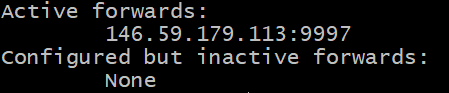
Check if the connection between the forwarder and the Splunk instance is active: Execute the following command on the host machine:
docker exec -it fp-csg-splunk-universal-forwarder /bin/bash -c "/opt/splunkforwarder/bin/splunk list forward-server"
It might prompt you for username (admin) and password (the one you setup in step 3 of Implementation - Docker). Verify the output is similar to below:
-
Check the splunk fp-csg-splunk-universal-forwarder is forwarding data with no errors.
docker exec -it fp-csg-splunk-universal-forwarder /bin/bash -c "cat /opt/splunkforwarder/var/log/splunk/health.log" -
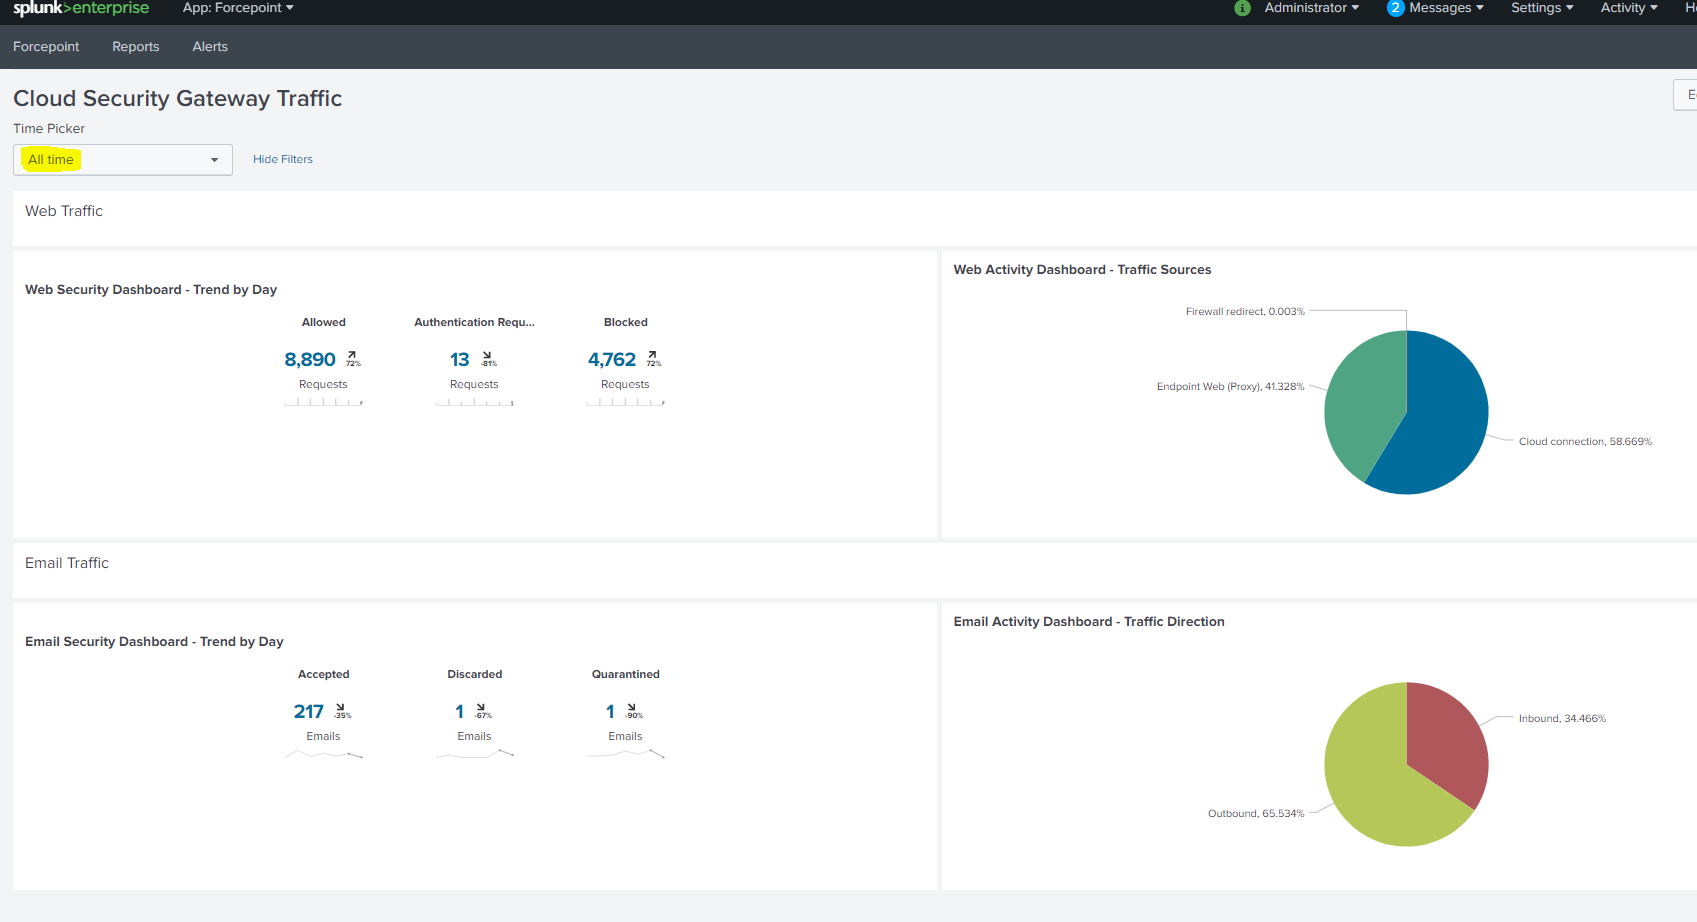
Check after 10 minutes after running the integration: user should see data in the Splunk app
Check the output is similar to the one shown below: